Visual Dashboard User Guide
The Laravel Agent-Debugger includes a zero-dependency, local-only interactive SPA (Single Page Application) dashboard served directly from your application server. It displays real-time execution statistics, query timelines, background job tracing, memory allocation flame-graphs, and integrates a suite of diagnostic utility tools.
🚀 Accessing the Dashboard
Once the package is installed and enabled (AGENT_DEBUGGER_ENABLED=true in .env), you can access the dashboard by navigating to:
http://your-local-app-url/_agent_debug/dashboardFor standard local development servers, this is typically:
NOTE
The dashboard is strictly locked to local/development environments. In production or non-dev environments with composer install --no-dev, the route is completely unregistered to prevent any memory footprint or security risks.
🎨 Dashboard Interface Tour
The dashboard uses a dark glassmorphic design that runs 100% offline using localized asset routing.
graph TD
    A[Dashboard Header] --> B[System Config & Service Alerts]
    A --> C[Artisan Quick-Console Controls]
    D[Sidebar Panel] --> E[Real-Time Request Feed via SSE]
    D --> F[Active Tag & Environment Filter]
    G[Main Content Area] --> H[13 Diagnostic Information Tabs]
1. The Header Panel
- VCS Status Badge: Shows the active Git branch and the count of uncommitted/dirty files. Clicking this alerts you to changes that might affect performance.
- Artisan Quick-Console: Three primary action buttons:
🧹 Clean Logs: Purges all compiled profiling logs.💾 Clear Cache: Runsphp artisan cache:clearto flush app caches.🛣️ Clear Routes: Runsphp artisan route:clearto refresh routing caches.
- Dev Environment Shield: Displays blinking warning banners if local SMTP/Redis services are configured but unreachable.
2. The Request Sidebar (Real-time Feed)
- Displays a list of recent HTTP requests with color-coded HTTP methods (
GET,POST,PUT,DELETE,PATCH). - Live SSE Pulse: A green pulse indicator indicates that the Server-Sent Events (SSE) connection is open and streaming new requests instantly.
- Tag Filtration: Quick filters let you scope the request list to specific URLs, slow requests, error requests, or custom debug tags (
?_debug_tag=x).
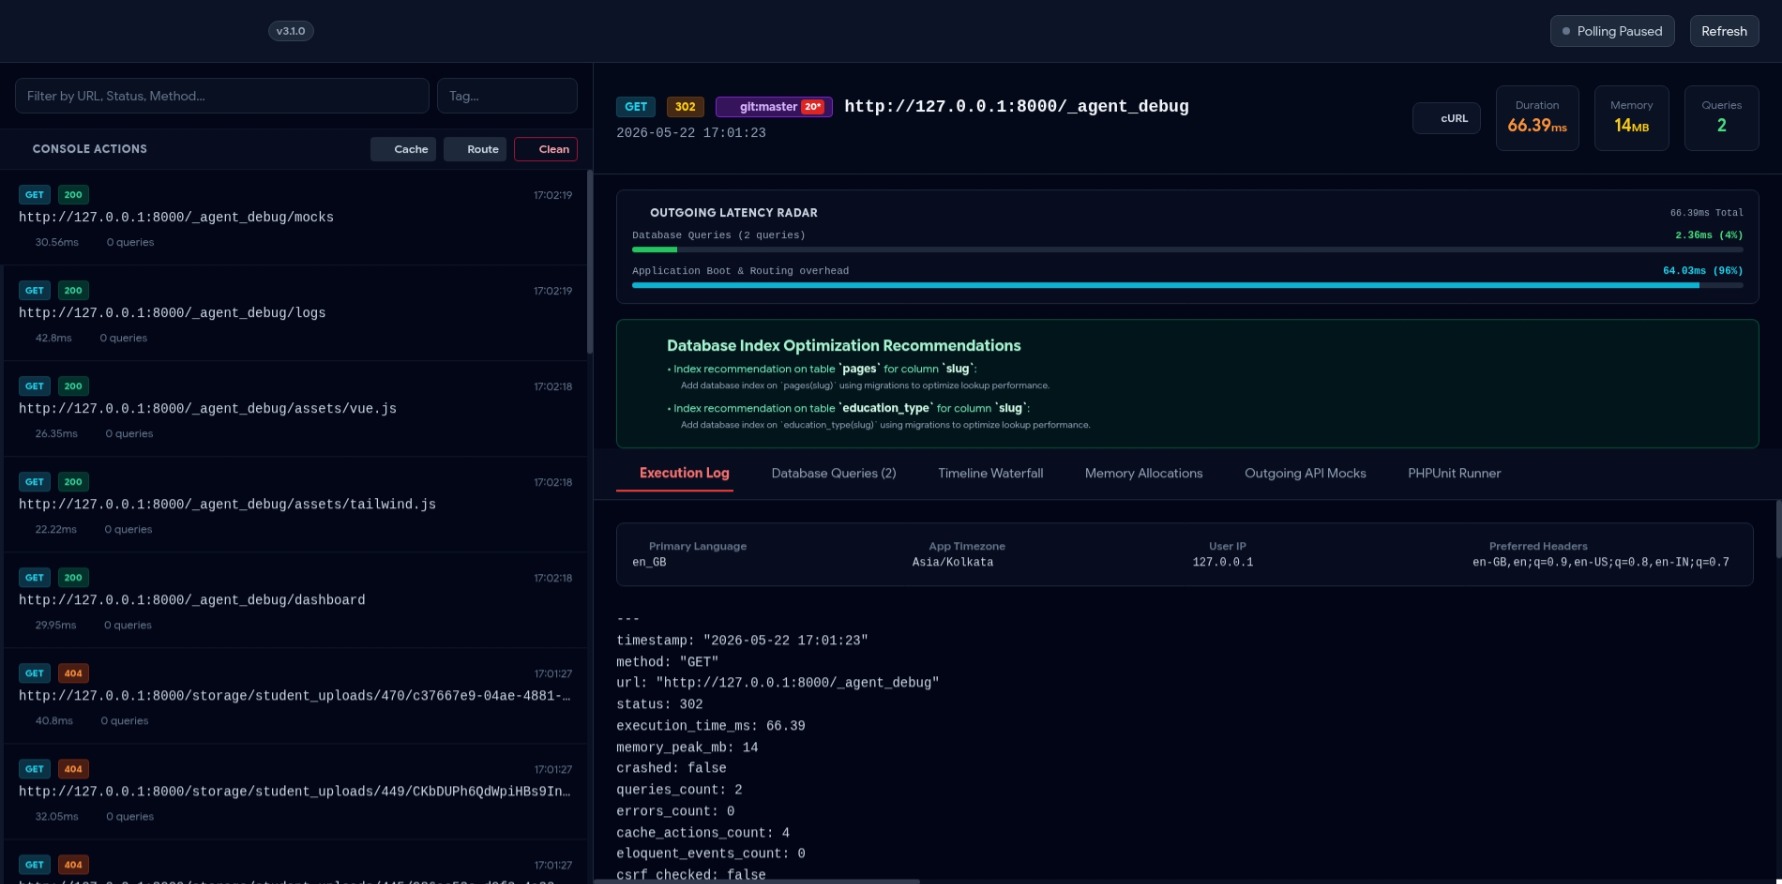
3. The Main Detail View (13 Tabs)
When a request is selected from the sidebar, the main workspace displays the full telemetry analysis segmented into 13 tabs.
🛠️ How to Use the Diagnostic Tools
1. Running PHPUnit Tests
Run your test suites and watch output stream in real-time without leaving your browser:
- Navigate to the 🧪 PHPUnit Runner tab.
- Click the green ▶ Run Test Suite button.
- The integrated terminal emulator will output the test progress (green dots, failure traces, assertion statistics) dynamically.
2. Optimizing Database Queries
Identify slow SQL and diagnose performance bottlenecks:
- Duplicate Queries: Flagged with yellow warning borders. The advisor recommends specific Laravel cache patterns.
- Visual SQL EXPLAIN: Click the
🔬 Explainbutton next to any logged query. The dashboard executes an execution plan analysis, mapping out sequential scans vs. index usage. - Index Advisor: Evaluates columns in your
WHEREandJOINfilters. It outputs copy-pasteable migration schema statements if it detects missing database indexes. - SQL Playground: A read-only sandbox allowing you to run custom queries directly in the browser. You can click
Send to Playgroundnext to any logged query to run and optimize it live.
3. Debugging Outgoing Mail
Inspect email layouts and content without external Mailpit or Mailtrap servers:
- Trigger any email/Mailable from your application.
- Go to the 📧 Outgoing Mail tab.
- You will see a list of sent emails. Click one to view a vector-perfect rendering of the email HTML body, subject headers, and recipient details.
4. Interactive Blade View Composition Tree
Trace nested view hierarchies, layout structures, and partial components:
- Navigate to the 🗺️ Blade Views tab.
- The page renders a tree diagram illustrating layout files nesting partial templates, components, and Blade layout structures.
- Hovering over a view node displays the absolute path of the Blade template.
5. Outgoing API Mocks Builder
Stub third-party API responses globally:
- Navigate to the 🎭 Outgoing API Mocks tab.
- Click ➕ Add Mock Rule.
- Specify a URL pattern (e.g.
api.stripe.com/v3/*), target response status code (e.g.200or402), and a mock JSON response body. - Click Save Rule.
- The package intercepts matching HTTP requests using Laravel's native HTTP Client faking mechanism, returning your stub payload instantly.
⚙️ Customizing the Dashboard UI
You can toggle the dashboard components or customize request payload limits within config/agent-debugger.php:
// Toggle the floating active viewport status badge on the frontend
'show_frontend_indicator' => env('AGENT_DEBUGGER_INDICATOR', true),

// Control the payload samples size retained in Inertia / database dumps
'payload_sample_size' => 2,

// Exclude specific routes or external assets from appearing in logs
'except' => [
    '_debugbar/*',
    'horizon/*',
    'telescope/*',
],